2.9 KiB
| title | summary | linktitle |
|---|---|---|
| Monitoring with Prometheus | A Simple recipe to monitor Ozone using Prometheus | Prometheus |
Prometheus is an open-source monitoring server developed under under the Cloud Native Computing Foundation.
Ozone supports Prometheus out of the box. The servers start a prometheus compatible metrics endpoint where all the available hadoop metrics are published in prometheus exporter format.
Prerequisites
- [Install the and start]({{< ref "start/RunningViaDocker.md" >}}) an Ozone cluster.
- Download the prometheus binary.
Monitoring with prometheus
(1) To enable the Prometheus metrics endpoint you need to add a new configuration to the ozone-site.xml file:
  <property>
    <name>hdds.prometheus.endpoint.enabled</name>
    <value>true</value>
  </property>
Note: for Docker compose based pseudo cluster put the OZONE-SITE.XML_hdds.prometheus.endpoint.enabled=true line to the docker-config file.
(2) Restart the Ozone Manager and Storage Container Manager and check the prometheus endpoints:
(3) Create a prometheus.yaml configuration with the previous endpoints:
global:
  scrape_interval:     15s

scrape_configs:
  - job_name: ozone
    metrics_path: /prom
    static_configs:
     - targets:
        - "scm:9876"
        - "ozoneManager:9874"
(4) Start with prometheus from the directory where you have the prometheus.yaml file:
prometheus
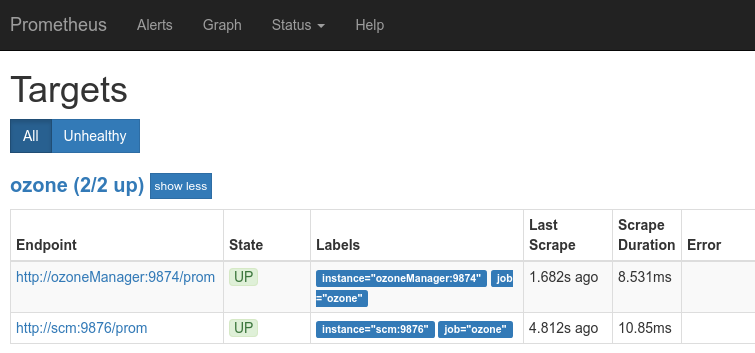
(5) Check the active targets in the prometheus web-ui:
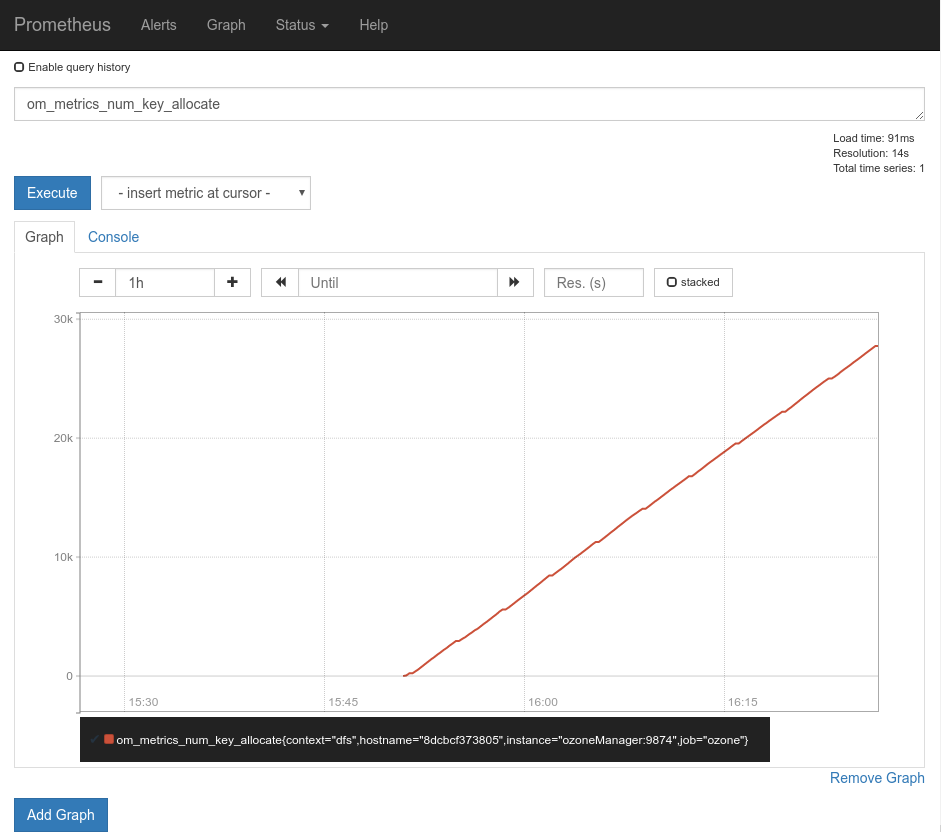
(6) Check any metrics on the prometheus web ui. For example:
http://localhost:9090/graph?g0.range_input=1h&g0.expr=om_metrics_num_key_allocate&g0.tab=1
Note
The ozone distribution contains a ready-to-use, dockerized environment to try out ozone and prometheus. It can be found under compose/ozoneperf directory.
cd compose/ozoneperf
docker-compose up -d

